plot_sdg creates a (stacked) barplot of the frequency distribution of SDGs identified via detect_sdg or detect_sdg_systems.
plot_sdg(
  hits,
  systems = NULL,
  sdgs = NULL,
  normalize = "none",
  color = "unibas",
  sdg_titles = FALSE,
  remove_duplicates = TRUE,
  ...
)
Arguments
- hits
data frameas returned bydetect_sdgordetect_sdg_systems. Must include columnssdgandsystem.- systems
charactervector specifying the query systems to be visualized. Values must be available in thesystemcolumn ofhits.systemsof length greater 1 result, by default, in a stacked barplot. Defaults toNULLin which case available values are retrieved fromhits.- sdgs
numericvector with integers between 1 and 17 specifying the SDGs to be visualized. Values must be available in thesdgcolumn ofhits. Defaults toNULLin which case available values are retrieved fromhits.- normalize
characterspecifying whether results should be presented as frequencies (normalize = "none"), the default, or whether the frequencies should be normalized using either the total frequencies of each system (normalize = "systems") or the total number of documents (normalize = "documents").- color
charactervector used to color the bars according to systems. The default,"unibas", uses three colors of University of Basel's corporate design. Alternatively,colormust specified using color names or color hex values.colorwill be interpolated to match the length ofsystems.- sdg_titles
logicalspecifying whether the titles of the SDG should added to the axis annotation.- remove_duplicates
logicalspecifying the handling of multiple hits of the same SDG for a given document and system. Defaults toTRUEimplying that no more than one hit is counted per SDG, system, and document.- ...
arguments passed to
geom_bar.
Value
The function returns a ggplot object that can either be stored in an object or printed to produce the plot.
Details
The function is built using ggplot and can thus be flexibly extended. See examples.
Examples
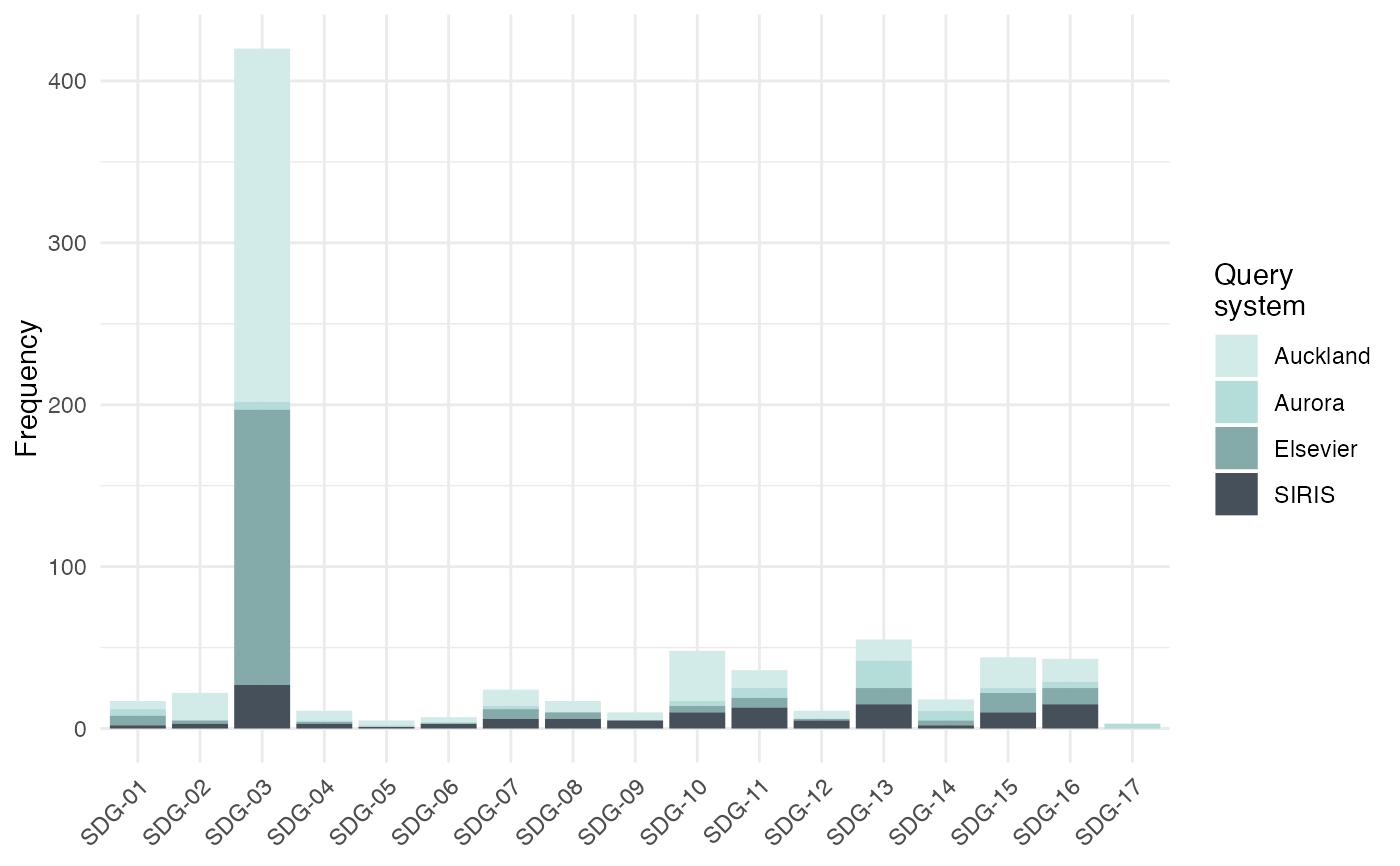
# \donttest{
# run sdg detection
hits <- detect_sdg_systems(projects)
#> Running Aurora
#> Running Elsevier
#> Running Auckland
#> Running SIRIS
# create barplot
plot_sdg(hits)
#> 44 duplicate hits removed. Set remove_duplicates = FALSE to retain duplicates.
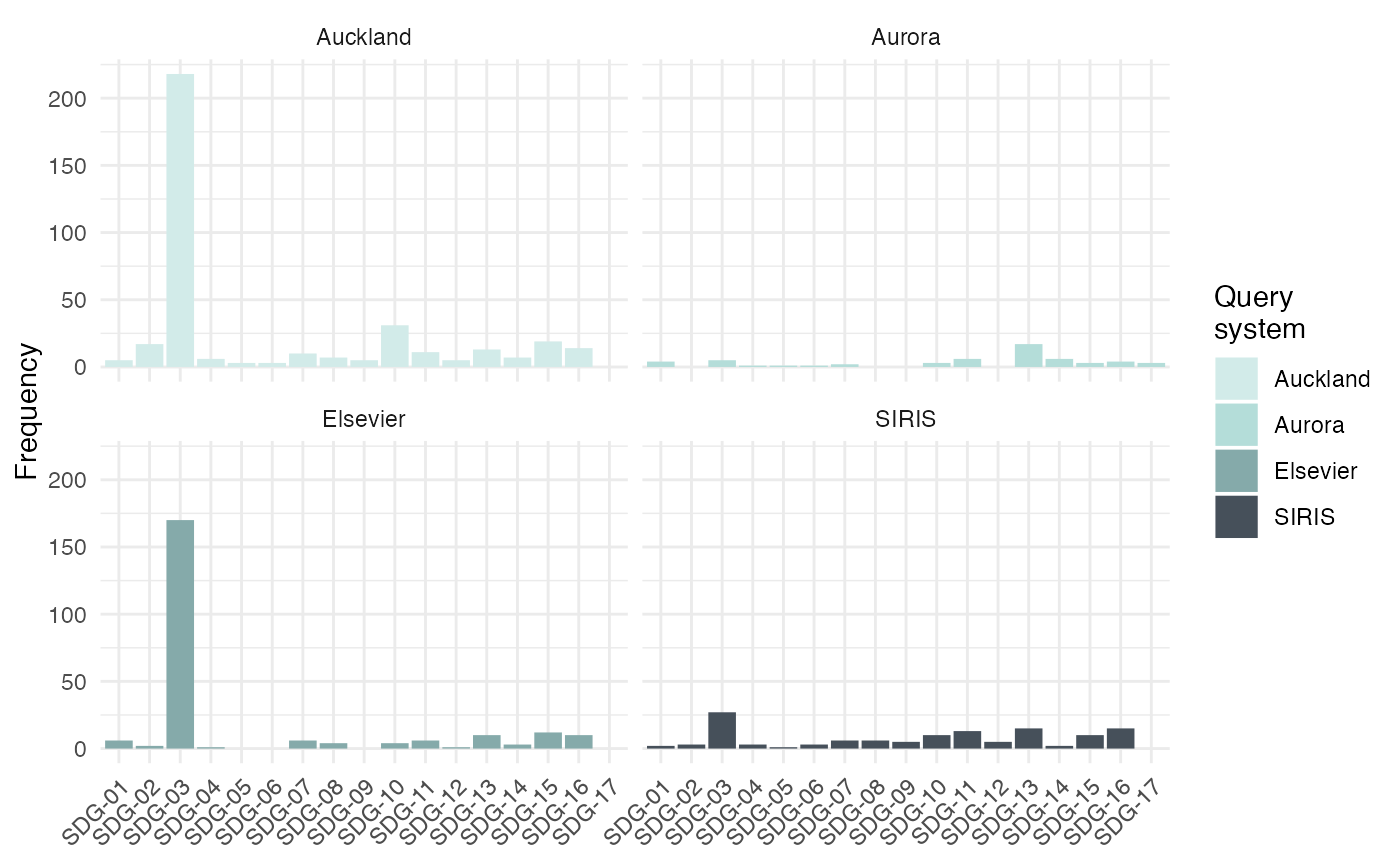
 # create barplot with facets
plot_sdg(hits) + ggplot2::facet_wrap(~system)
#> 44 duplicate hits removed. Set remove_duplicates = FALSE to retain duplicates.
# create barplot with facets
plot_sdg(hits) + ggplot2::facet_wrap(~system)
#> 44 duplicate hits removed. Set remove_duplicates = FALSE to retain duplicates.
 # }
# }